


Consumption of Sugars in Canada
Sugars consumption in Canada has been a hot topic lately, especially when it comes to how much we are eating compared to dietary guidelines and what it means for our health. So how much sugars are Canadians consuming, and what foods and beverages are the biggest contributors?
|
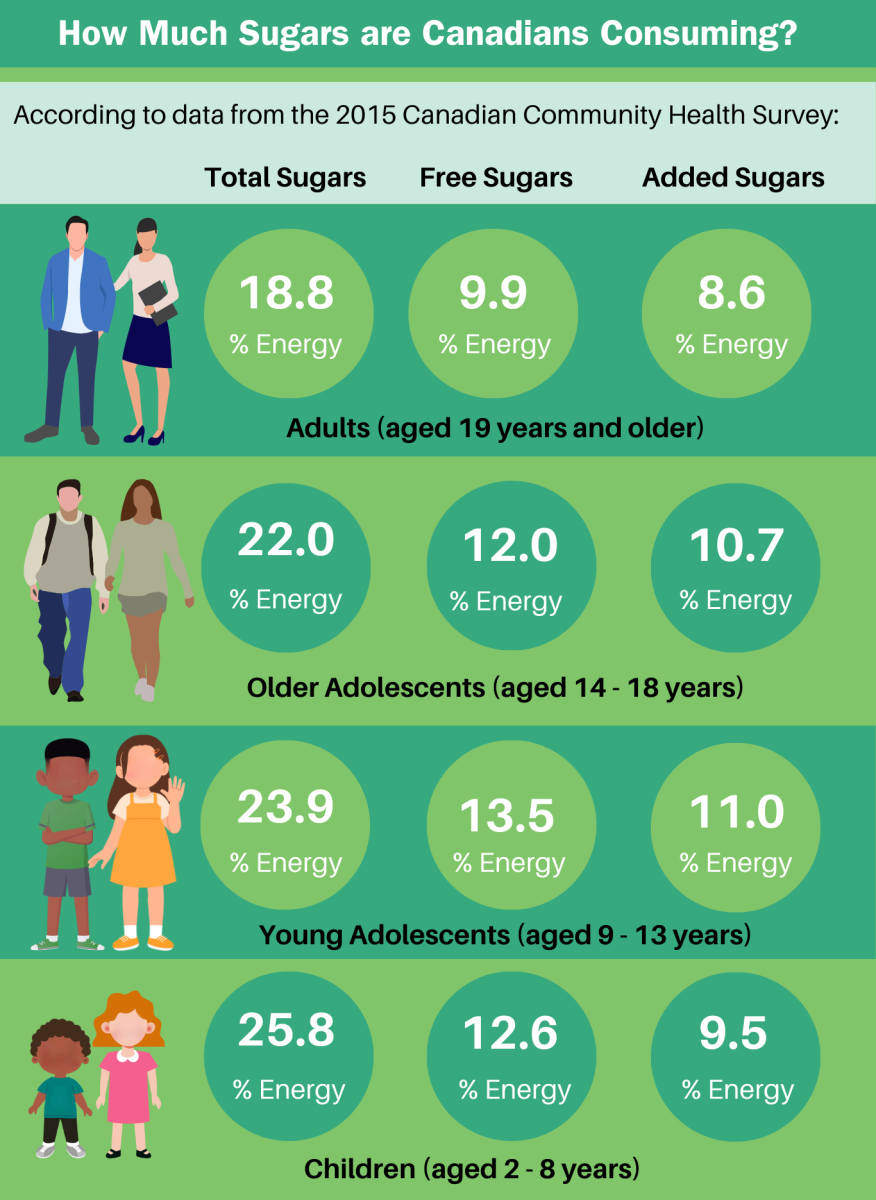
Canadians consume on average 8.6% to 11% daily energy from added sugars, depending on their age. |
Consumption of added sugars has been declining in Canada over the past twenty years. |
Fruit is a top source of total sugars intakes for all age groups, but adolescents and adults consume more added sugars than children. |
How much sugars are Canadians consuming?
On average, Canadians get 8.6% to 11% of their daily energy from added sugars, depending on their age1-3. Adults consume the lowest amounts of added sugars, while adolescents consume higher amounts (see graphic below). Added sugars are sugars and syrups that are added to foods and drinks when they are processed or prepared.
How do sugars intakes in Canada compare to dietary guidelines?
While Canada’s Food Guide doesn’t have a specific quantitative dietary recommendation for sugars, we can compare average sugars intakes in Canada to international recommendations:
| Organization | Guideline | How Canada Compares |
|---|---|---|
| World Health Organization (2015) | Recommendation to reduce free sugars (sugars added to foods and beverages, plus those found naturally in honey, syrups, and fruit juice) to less than 10% of daily energy intake based on evidence in relation to dental caries |
|
Did you know?
Media articles in Canada often quote American sugars consumption statistics. However, Canadian adults consume nearly 1/3 less added sugars than US adults, mostly because Canadians drink fewer soft drinks1-8.
Declining trend in added sugars intakes in Canada
Added sugars intakes in Canada have been declining over the past twenty years. This can be assessed using (1) national dietary survey data and (2) per capita food availability data as described below.
- National dietary survey data from the Canadian Community Health Survey, which looks at individual intakes
- In adults, consumption of total, free, and added sugars declined between 2004 and 2015.
- Total sugars intake dropped from 20% to 18.8% energy and added sugars intake dropped from 9.9% to 8.6% energy.
- Free sugars saw the largest decline, dropping from 11.4% to 9.9% energy (see graph below).
- Note: Differences in how survey data was collected as well as changes in population demographics (e.g. older age), between CCHS 2004 and CCHS 2015 may have influenced results1-2,9-12.
.png)
- Per capita annual food availability data (adjusted for loss), which estimates the amount of sugars available in the market per person (at a country level, not an individual level)
- According to market availability trends, added sugars intake in Canada has gradually declined over the past 20 years (see graph below).
- In 2025, the estimated loss-adjusted* per capita added sugars consumption in Canada was 10.5% energy (a decline from 12.4% energy in 2005).
- The largest contributor to the decline comes from a 59% decrease in soft drinks availability.
- This reduction aligns with trends observed in CCHS data and is consistent with trends seen in other countries like the United States, the United Kingdom, and Australia13-16.

Data source: Data source: Statistics Canada. Adjusted for waste using updated USDA Loss-Adjusted Food Availability. Includes refined sugar, maple sugar, honey and sugars in soft drinks. Variability in sugars and syrups reflects substituting sugar with high fructose corn syrup in soft drinks. Sugars in soft drinks is an overestimate as soft drink data includes non-caloric soft drinks.
*An adjustment factor has been applied to account for losses that occur in distribution, storage, preparation, and consumption (e.g., discarded or spoiled) of added sugars containing foods and beverages.
How does sugars consumption compare to obesity rates in Canada?
Excess energy intake from all sources of foods and beverages, including sugars, is associated with greater risk of obesity17. While market availability data shows that trends in added sugars intake in Canada have been declining, rates of obesity continue to rise18.

Where are Canadians getting their sugars from?
Health Canada recommends consuming a healthy eating pattern “where most sugars come from fruits, vegetables, and unsweetened dairy products, such as unsweetened milk or yogurt”. According to analysis by Statistics Canada of CCHS 2015 data11:
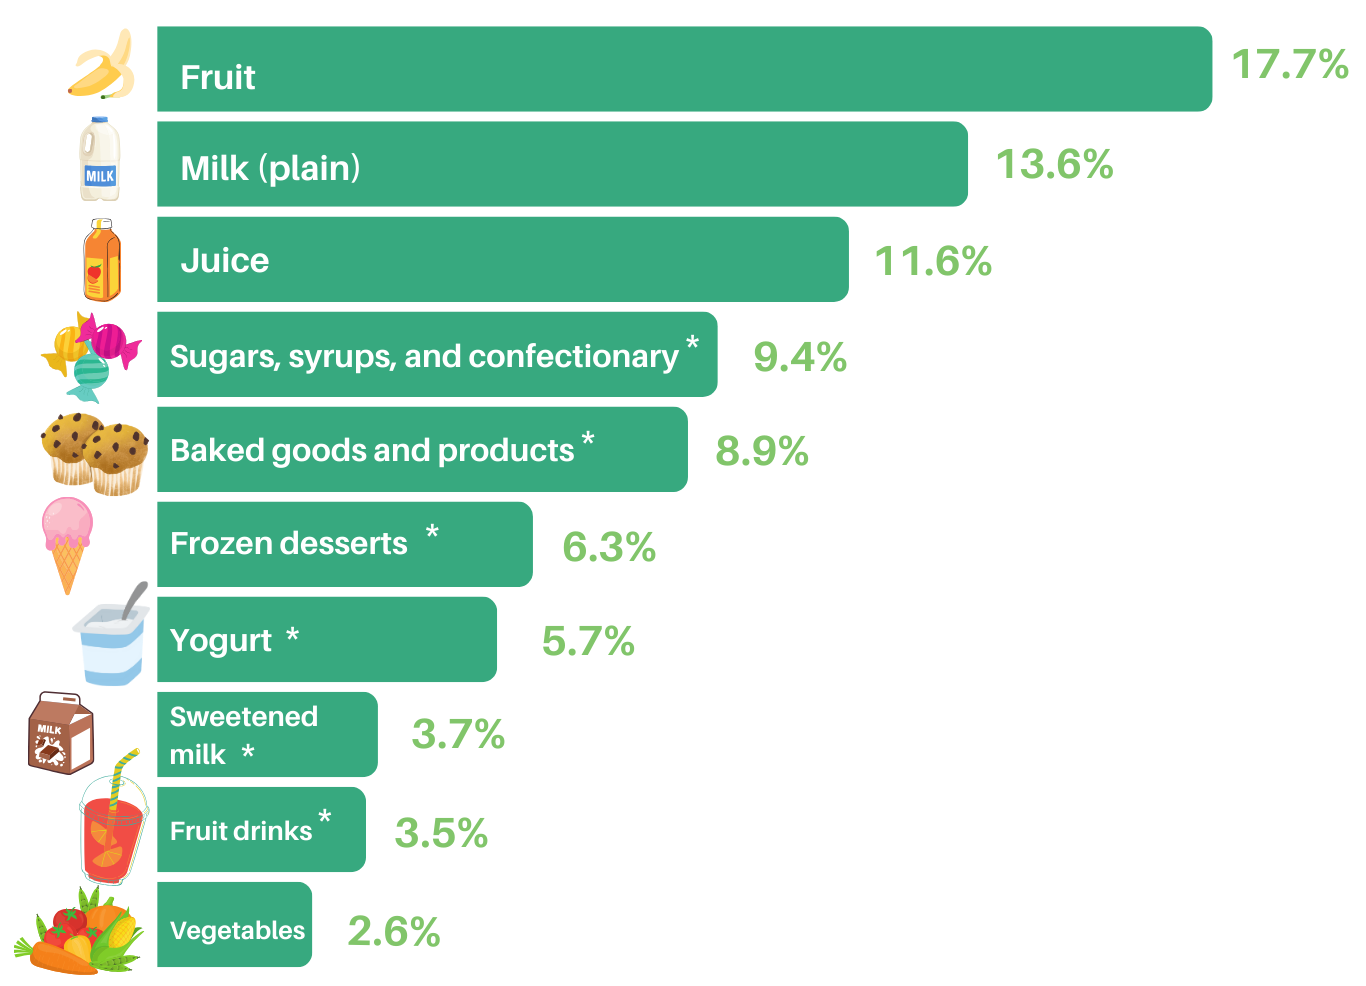
Children (2-8 years old): Fruit was the biggest source of total sugars. The greatest proportion of children’s total sugars came from naturally occurring sources such as fruit, plain milk, fruit juice, and vegetables.
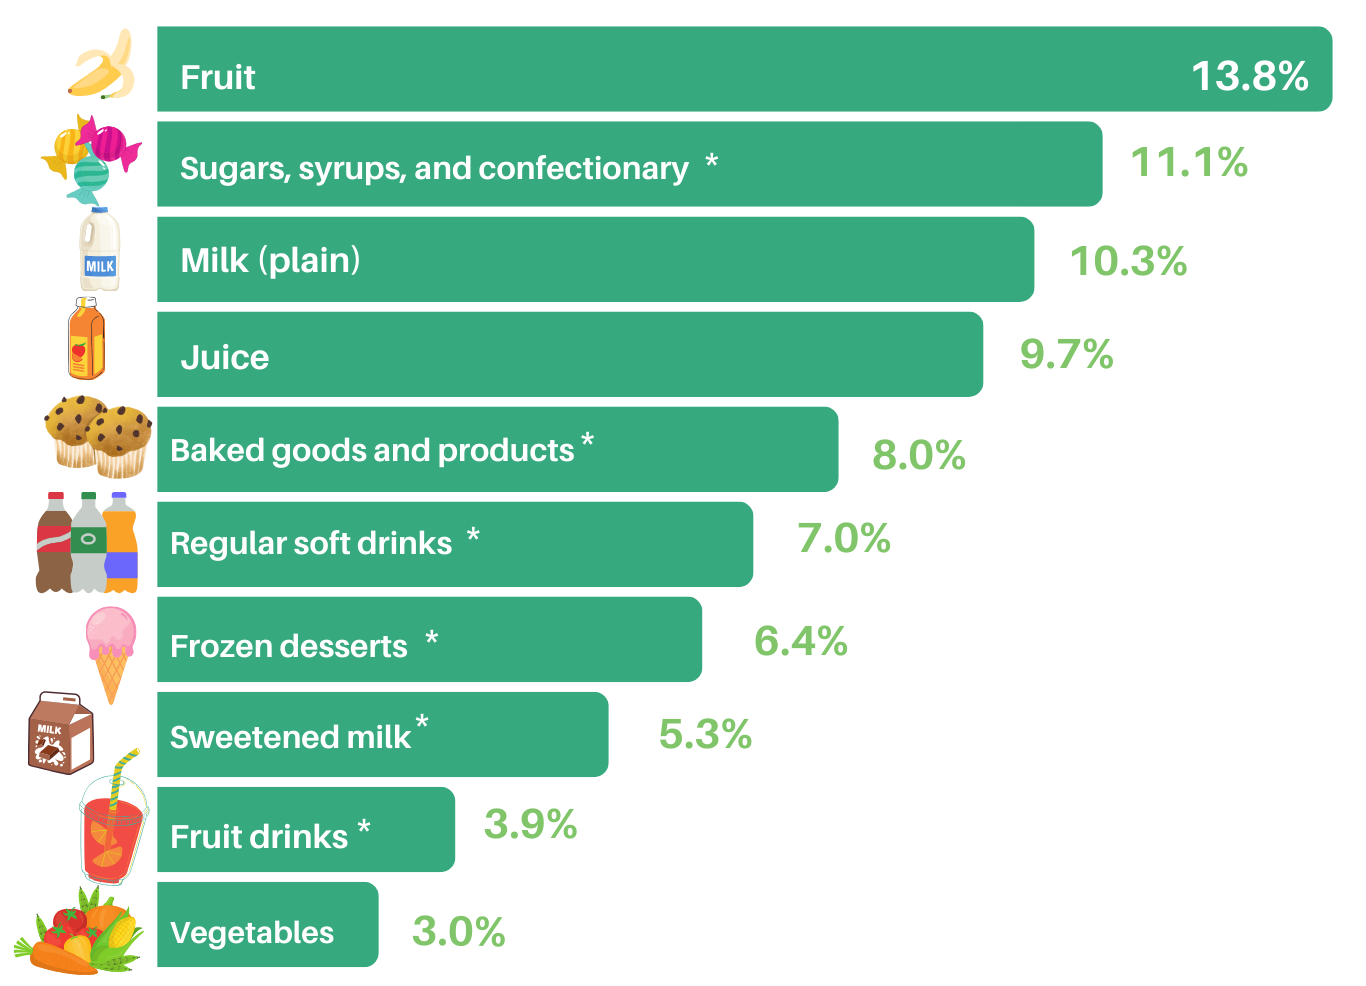
 Adolescents (9-18 years old): Fruit, plain milk and juice are among the top sources of total and naturally occurring sugars. Sources of added sugars like soft drinks and fruit drinks, baked goods, confectionery and frozen desserts, made up a greater percentage of their total sugars intake compared to children.
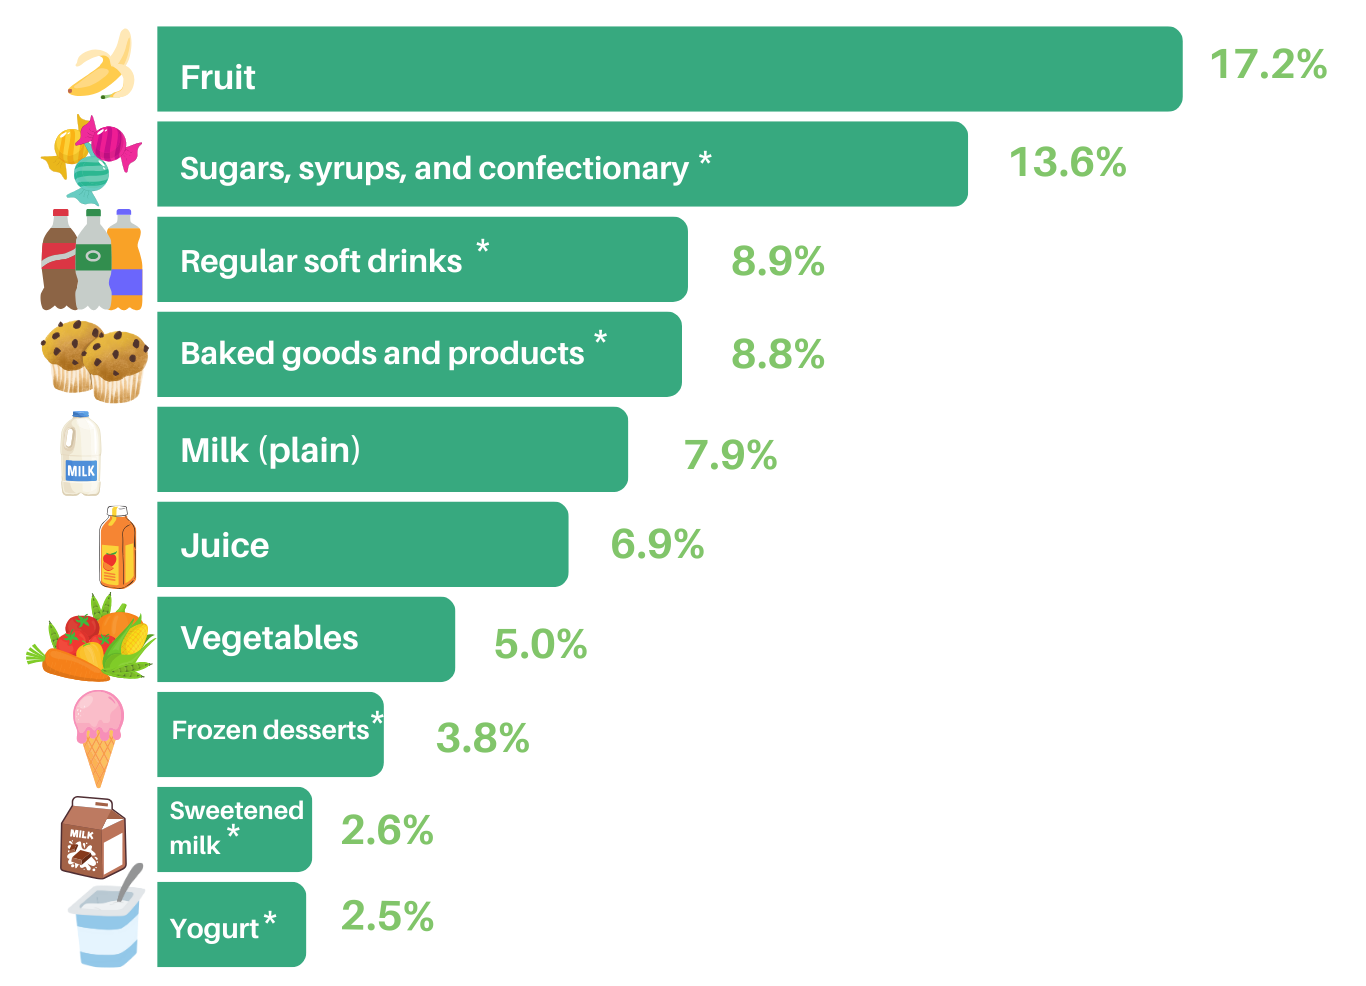
 Adults (19+ years old): Like adolescents, adults consumed more of their sugars from added sources, but fruit remained a key contributor
*indicates source of added sugars
Nutrient intakes across different levels of total sugars intakes
Comparing individuals with high or low intakes of total and added sugars, those consuming a moderate amount of total and added sugars had higher intakes of some key nutrients and vitamins and minerals, such as vitamin C and potassium. This was primarily due to higher intakes of fruit and dairy products1-2.
.png)
Relationship between sugars and fat intakes
The sugar-fat see-saw phenomenon
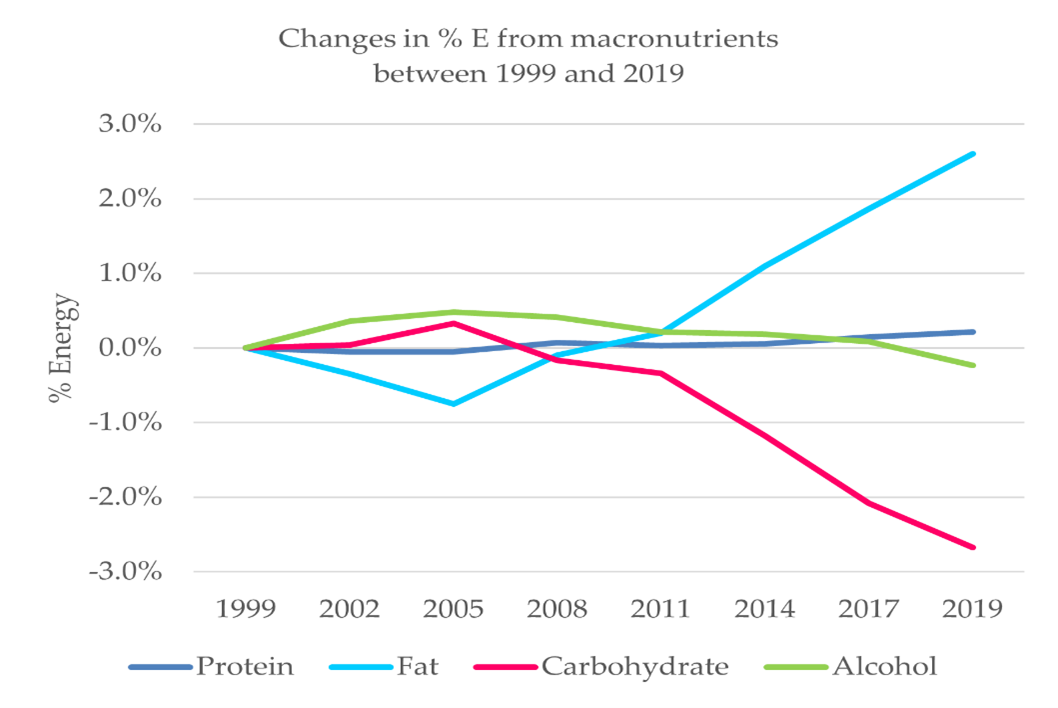
A notable pattern in dietary intakes is the “sugar-fat seesaw” – that is, at lower intakes of total sugars there are higher intakes of fat, including saturated fat - and vice versa – likely due to differences in food choices19. A similar trend has been observed in Canadian per capita availability of macronutrients over the past twenty years, where there was a decline in energy from carbohydrate, including added sugars, starch, and fibre, accompanied by an increase in energy from fat (see graph below)4. This inverse relationship between sugars and fat intake mirrors observations in other countries such as the United States and Australia19 and suggests a need to consider overall dietary balance.
For more information, additional resources include:
- Infographic - Sugars Consumption in Canada (Updated June 2026)
- Fact Sheet - Frequently Asked Questions: Sugars Consumption
- Intakes of nutrients and food categories in Canadian children and adolescents across levels of sugars intake: Cross-sectional 1 analyses of the Canadian Community Health Survey 2015 Public Use Microdata File (2022)
- Canadian Adults with Moderate Intakes of Total Sugars Have Greater Intakes of Fibre and Key Micronutrients: Results from the Canadian Community Health Survey 2015 Public Use Microdata File (2020)
- Estimated intakes and sources of total and added sugars in the Canadian diet.
- Video - How Much Sugar Do Canadians Eat? featuring nutrition researcher Dr. Nick Bellissimo and registered dietitian Christy Brissette
Recent news items include:
- July 2024 - Updated Estimated Added Sugars Consumption Trends in Canada Now Available
- May 2024 - Added Sugars Intake and Diet Quality: Research Poster Presentation
- June 2023 - Updates on Estimated Added Sugars Consumption Trends in Canada
- November 2022 - Association Between Added Sugars Intake and Diet Quality in Children
- July 2022 - Declining Trend in Estimated Sugars Consumption in Canada Continues
- February 2022 - How Much Sugars are Canadian Children and Adolescents Consuming?
- July 2021 - Updates on Estimated Added Sugars Consumption in Canada
- July 2020 - Updates on Estimated Added Sugars Consumption in Canada based on Canadian Community Health Survey - Nutrition 2015 and Statistics Canada Food Availability Database
- January 2019 - Canadian Sugar Institute - Highlights of Statistics Canada Sugars Consumption Report
- June 2018 - Update on Estimated Added Sugars Consumption in Canada
- March 2018 - Dietary Intake and Food Sources of Added Sugars Among Americans. New Research Findings from NHANES 2009-2012.
- June 2017 - New Release from Statistics Canada: Canadian Community Health Survey 2015 Reports Changes in Nutrient Intakes Among Canadians Compared to 2004
- June 2017 - How Much Sugars Do Canadians Consume?
- December 2015 - A Review of Sugar Consumption From Nationally Representative Dietary Surveys Across the World
- February 2015 - Worldwide Trends in Sugars Intake - Stable or Declining
References
- Wang YF, Chiavaroli L, Roke K, DiAngelo C, Marsden S, Sievenpiper J. Canadian Adults with Moderate Intakes of Total Sugars have Greater Intakes of Fibre and Key Micronutrients: Results from the Canadian Community Health Survey - Nutrition 2015 Public Use Microdata File. Nutrients. 2020 Apr 17;12(4):E1124.
- Chiavaroli L, Wang YF, Ahmed M, Ng AP, DiAngelo C, Marsden S, Sievenpiper JL. Intakes of nutrients and food categories in Canadian children and adolescents across levels of sugars intake: Cross-sectional 1 analyses of the Canadian Community Health Survey 2015 Public Use Microdata File. Appl Physiol Nutr Metab. 2022;47:415-28.
- Louie JCY, Moshtaghian H, Boylan S, Flood VM, Rangan AM, Barclay AW, Brand-Miller JC, Gill TP. A systematic methodology to estimate added sugar content of foods. Eur J Clin Nutr. 2015;69(2):154-61.
- Wang YF, Marsden S, Chiavaroli L, DiAngelo C, Sievenpiper JL. Trends in Loss-Adjusted Availability of Added Sugars and Energy Contribution from Macronutrients and Major Food Groups in Canada and the United States. JANA. 2023;24(5):459-68.
- US Department of Agriculture, Agricultural Research Service, Beltsville Human Nutrition Research Center Food Surveys Research Group. WWEIA Data Tables [Internet]. Beltsville, Maryland: US Department of Agriculture;2022 Aug 3 [cited 2024 Feb 29].
- Bowman SA, Clemens JC, Friday JE, LaComb RB, Paudel D, Shimizu M. Added Sugars in Adults' Diet: What We Eat in America, NHANES 2015-2016. Food Surveys Research Group. Dietary Data Brief No. 24;2019.
- Welsh JA, Sharma AJ, Grellinger L, Vos MB. Consumption of added sugars is decreasing in the United States. Am J Clin Nutr. 2011;94:726-34.
- Ricciuto L, Fulgoni VL, Gaine PC, Scott MO, DiFrancesco L. Trends in Added Sugars Intake and Sources Among US Children, Adolescents, and Teens Using NHANES 2001–2018. J Nutr. 2022 Feb 8;152(2):568-78.
- Brisbois TD, Marsden SL, Anderson GH, Sievenpiper JL. Estimated intakes and sources of total and added sugars in the Canadian diet. Nutrients. 2014;6(5):1899-1912.
- Agriculture and Agri-Food Canada. An Overview of the Canadian Agrictulture and Agri-Food System [Internet]. Ottawa, ON: Government of Canada; 2023 July 6 [cited 2024 Feb 29].
- Langlois K, Garriguet D. Change in total sugars consumption among Canadian children and adults [Internet]. Ottawa, ON: Statistics Canada Health Reports; 2019 Jan 16 [cited 2024 Feb 29].
- Garriguet D. Accounting for misreporting when comparing energy intake across time in Canada. Health Rep. 2018;29:3-12.
- DiFrancesco L, Fulgoni III, VL, Gaine PC, Scott MO, Ricciuto L. Trends in added sugars intake and sources among U.S. adults using the National Health and Nutrition Examination Survey (NHANES) 2001-2018. Front Nutr. 2022 Aug 18;9:897952. doi: 10.3389/fnut.2022.897952.
- Probst YC, Charlton KE, Davison SJ, Louie CY. Trends in food sources of added sugar in Australian eating patterns between 1995 and 2012 using national consumption survey data. J. Hum. Nutr. Diet. 2021;34(2):286-99.
- Amoutzopoulos B, Steer T, Roberts C, Collins D, Page P. Free and added sugar consumption and adherence to guidelines: The UK National Diet and Nutrition Survey (2014/15-2015/16). Nutrients. 2020;12(2):393. doi: 10.3390/nu12020393.
- Walton J, Bell H, Re R, Nugent AP. Current perspectives on global sugar consumption: definitions, recommendations, population intakes, challenges and future direction. Nutr Res Rev. 2023;36(1) :1-22.
- Te Morenga L Mallard S, Mann J. Dietary sugars and body weight: systematic review and meta-analyses of randomised controlled trials and cohort studies. BMJ. 2012 Jan;346:e7492.
- Statistics Canada. An overview of weight and height measurements on World Obesity Day. [Internet]. Ottawa, ON: Statistics Canada; 2024 Mar 4 [cited 2024 Oct 9].
- Sadler MJ, McNulty H, Gibson S. Sugar-fat seesaw: A systematic review of the evidence. Crit Rev Food Sci Nutr. 2015;55:338-56.